雅思写作练习题分享!环球教育Approach 雅思课程吸收端写作练习
2019-09-25 16:59:48来源:环球教育作者: 景景阅读量:
雅思写作练习题分享!环球教育Approach 雅思课程吸收端写作练习 为了能够让大家更好更有效的备考雅思写作,上名校小编为大家整理分享雅思写作练习题,供大家学习!环球教育雅思写作Approach 雅思课程吸收端练习题含答案,大家快来练练吧!

图片来源网络
动态图表
介绍句
英译中
1. In 1940 the proportion of people aged 65 or more stood at only 5% in Japan,
approximately 7% in Sweden and 9% in the US.
........................................................................................................................................
.......................................................................................................................
2. The table illustrates the differences in agricultural consumption in some areas of the
world by contrasting the amount of irrigated land in Brazil (26500 km³) with that in the
D.R.C. (100 km³).
........................................................................................................................................
.......................................................................................................................
3. The graph illustrates changes in the amounts of beef, lamb, chicken and fish
consumed in a particular European country between 1979 and 2004.
.......................................................................................................................................
........................................................................................................................
4. In 1979 beef was by far the most popular of these foods, with about 225 grams
consumed per person per week.
.......................................................................................................................................
........................................................................................................................
5. The charts compare the sources of electricity in Australia and France in the years
1980 and 2000.
.......................................................................................................................................
........................................................................................................................
中译英
1. 在 1980 年,澳大利亚将煤作为电能的主要来源(50 个单位),剩余来自于天然气,水
能(各 20 个单位),石油(仅仅 10 个单位)。
........................................................................................................................................
.......................................................................................................................
2. 图表显示了英国一所学校分别在 1981 年,1991 年和 2001 年在不同经营成本上的花费。
........................................................................................................................................
.......................................................................................................................
3. 这个线型图描述了英国 1974 到 2001 年期间,通过四种交通方式所运输的货物的总数
量。
........................................................................................................................................
.......................................................................................................................
4. 图表显示了在 1995 到 2002 期间,英国居民不同种类的电话的使用量。
........................................................................................................................................
.......................................................................................................................
5. 该曲线图显示了美国 1980 年至 2012 年的能源消费,以及至 2030 年的预计消费情况。
........................................................................................................................................
.........................................................................................................
Answer Key
动态图表
介绍句
英译中
1. 1940 年间,日本 65 岁以上人口百分比只有 5%,瑞典的 65 岁以上的人口比例大约为7%,美国的 65 岁以上人口比例为 9%。
2. 这个图表显示了一些地区农业用水量的数据,对比了在巴西需要灌溉的土地量(26500立方千米)和刚果共和国的灌溉土地量(100 立方千米)。
3. 这个线图显示了某个欧洲国家在 1979 年和 2004 年之间消费的牛肉、鸡肉和鱼肉的情况。
4. 在 1979 年,牛肉是最受欢迎的食物,每人每周消费 225 克。
5. 图表比较了澳大路亚和法国在 1980 年到 2000 期间,电能来源的情况。
中译英
1. In 1980 Australia used coal as the main electricity source (50 units) and the remainder was produced from natural gas, hydro power (each producing 20 units) and oil (which produced only 10 units).
2. The charts show how much a UK school spent on different running costs in three separate years: 1981, 1991 and 2001.
3. The graph illustrates the quantities of goods transported in the United Kingdom by four different modes of transport between the time period of 1974 and 2001.
4. The chart shows the time spent by UK residents on different types of telephone calls between 1995 and 2002.
5. The graph shows energy consumption in the US from 1980 to 2012, and projected consumption to 2030.
相关文章

6月11日雅思笔试写作真题全解析,附高分范文
社会话题 大作文题目 Today people live longer after retiring from work. What problems does this cause for individuals and society? What can be done to address these problems? 题目解读 人均寿...
阅读: 68


2021年12月雅思写作权威预测(谢鹏版)
2021年12月雅思写作权威预测,大作文90%的可能性是议论文,利弊分析题型的可能性最大。社会类(包括社会生活和体育等)及教育类的话题可能性最高。特...
阅读: 54
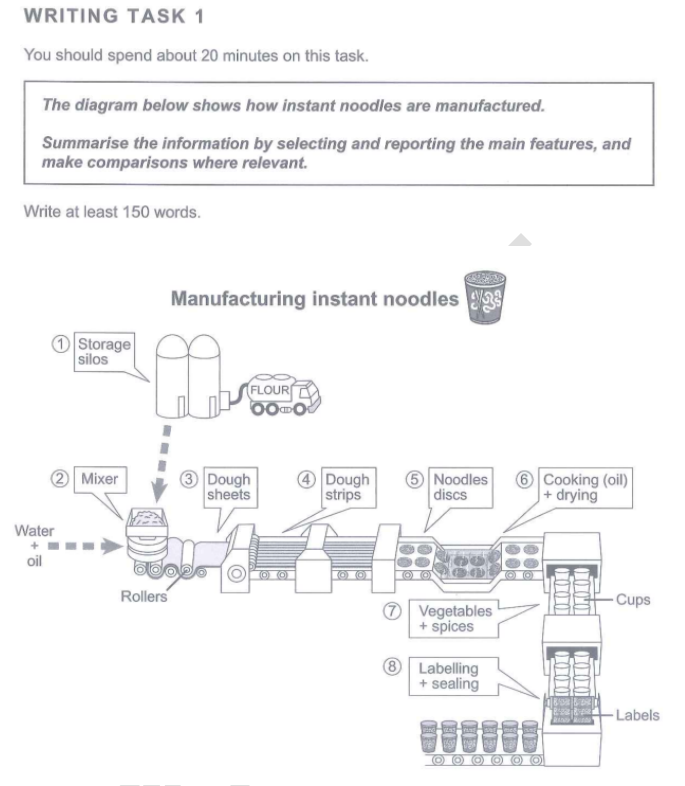
2022年1月雅思写作预测|小作文流程图题目及范文解析!
Inthenextstep,eachdrieddiscwillbeputintoacupandthencoveredbysomevegetablesandspicesFinally,thewholeprocessiscompletedbythoseinstantcupnoodlesbeingpackaged...
阅读: 78
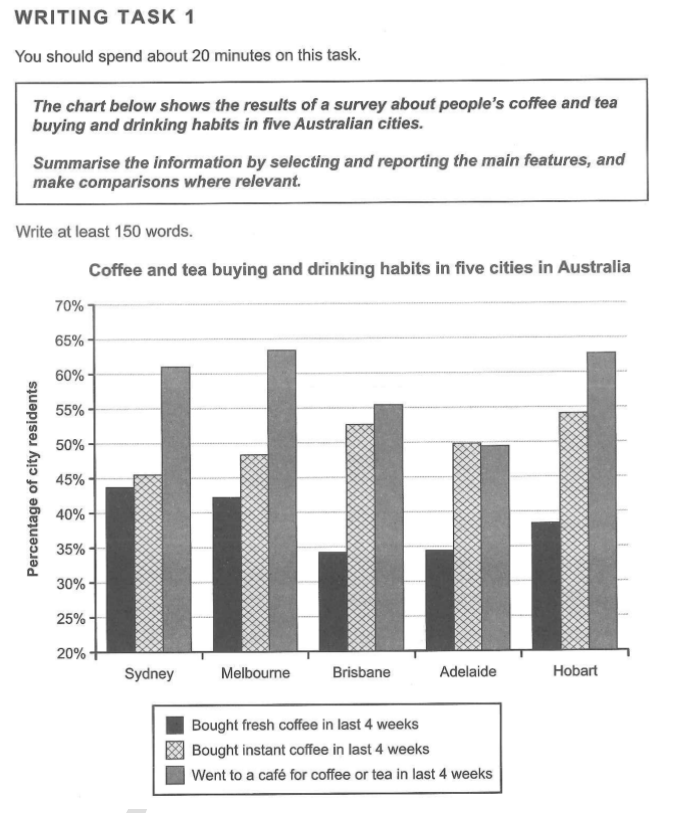
2022年1月雅思写作预测|小作文静态柱状图题目及范文解析!
Additionally,intermsofthosewhoboughtinstantcoffeeinlast4weeks,figuresofallfivecitiesarehigherthan45%,withHobartaccountingforthehighestproportionat54%,followedbyBrisbane(53%),Adelaide(50%),Melbourne(48%...
阅读: 71
热门文章
-
1.6月11日雅思笔试写作真题全解析,附高分范文
- 1
- 6月11日雅思笔试写作真题全解析,附高分范文
- 2022-06-13
- 1
-
2.雅思写作「环境类」词汇素材分享
- 2
- 雅思写作「环境类」词汇素材分享
- 2021-12-27
- 2
-
3.2021年12月雅思写作权威预测(谢鹏版)
- 3
- 2021年12月雅思写作权威预测(谢鹏版)
- 2021-12-27
- 3
-
4.2022年1月雅思写作预测|小作文流程图题目及范文解析!
- 4
- 2022年1月雅思写作预测|小作文流程图题目及范文解析!
- 2021-12-27
- 4
-
5.2022年1月雅思写作预测|小作文静态柱状图题目及范文解析!
- 5
- 2022年1月雅思写作预测|小作文静态柱状图题目及范文解析!
- 2021-12-27
- 5
-
6.2022年1月雅思写作预测|小作文动态图题及范文解析!
- 6
- 2022年1月雅思写作预测|小作文动态图题及范文解析!
- 2021-12-27
- 6
-
7.雅思写作:不同年龄层的人怎么准确地表达
- 7
- 雅思写作:不同年龄层的人怎么准确地表达
- 2021-12-27
- 7
-
8.12月25日雅思考试写作部分机经及解析
- 8
- 12月25日雅思考试写作部分机经及解析
- 2021-12-27
- 8
-
9.雅思写作精华语料| 老龄化及其解决办法!
- 9

- 雅思写作精华语料| 老龄化及其解决办法!
- 2021-12-22
- 9
-
10.雅思写作必备:百年党史关键词
- 10

- 雅思写作必备:百年党史关键词
- 2021-12-22
- 10
热门图文
-

剑16写作解析及高分范文 | TEST3 提高含糖食品价格
2021-07-29
-

雅思大作文环境类:环境影响商业 写作思路及范文赏析
2020-01-13
-

雅思大作文7分范文及解析:过分崇拜明星 写作思路分析
2020-01-07
-

雅思利弊类大作文社会类话题 一些语言正在消失 写作思路分析
2019-12-27
-

剑16写作解析 | TEST1了解建筑历史的原因与方式
2021-07-19
-

雅思大作文 平均工作时间更长的国家更成功 写作思路及范文
2020-02-04