2019年03月02日雅思写作Task 1外教范文分享,如何得高分?
2019-09-26 20:58:24来源:网络作者: 小Q阅读量:
2019年03月02日雅思写作Task 1外教范文,上名校小编为大家进行了整理,对于雅思写作有问题的学生大家可以具体的了解一下,掌握关于写作的方法,根据范文更好地提升,详细内容大家了解一下吧!
The chart below shows the percentage of the European family spending on an issue in an country per week in 1957 and 2000.

Blue 1957 Orange 2007
The column chart clearly depicts family household expenses over eight classifications, in a European country in the years 1957 and 2007. The measurement on the horizontal axis is time, the two years in question, whilst the vertical axis is measured as a percentage figure. (44 words)
At first glance, dramatic changes can be observed with housing and food, whilst other costs changed slightly or not at all, respectively, drinks and tobacco. (25 words)
A striking feature of this chart are the changes in transportation and food. In 1957, transport recorded a figure of 17%, however this rose dramatically in 2007, doubling at 33%. Food also shows significant changes, recording the highest percentage on the graph, at 34% in 1957, yet only to plummet dramatically to 14% in 2007. Furthermore, housing and fuel, showed little change, with marginal increases of around 4% in 2007. Whilst tobacco use remained steady at 6%, for the two recorded years, however, people were drinking less, dropping from a high of 12% in 1957 to almost half in 2007. Surprisingly, expenses with the others and services category, more than doubled to peak at 17% of home outlays. (118 words)
相关文章

6月11日雅思笔试写作真题全解析,附高分范文
社会话题 大作文题目 Today people live longer after retiring from work. What problems does this cause for individuals and society? What can be done to address these problems? 题目解读 人均寿...
阅读: 71


2021年12月雅思写作权威预测(谢鹏版)
2021年12月雅思写作权威预测,大作文90%的可能性是议论文,利弊分析题型的可能性最大。社会类(包括社会生活和体育等)及教育类的话题可能性最高。特...
阅读: 55
2022年1月雅思写作预测|小作文流程图题目及范文解析!
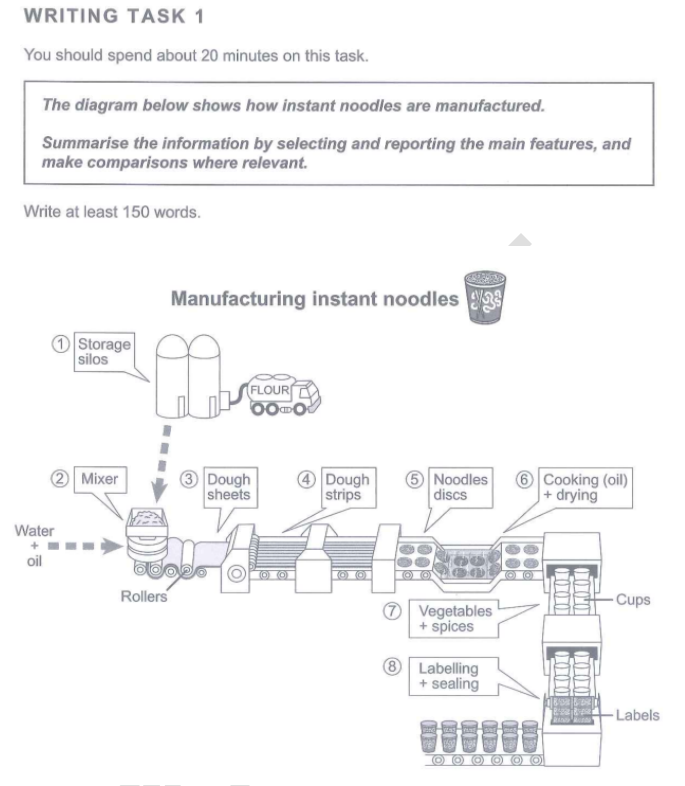
Inthenextstep,eachdrieddiscwillbeputintoacupandthencoveredbysomevegetablesandspicesFinally,thewholeprocessiscompletedbythoseinstantcupnoodlesbeingpackaged...
阅读: 83
2022年1月雅思写作预测|小作文静态柱状图题目及范文解析!
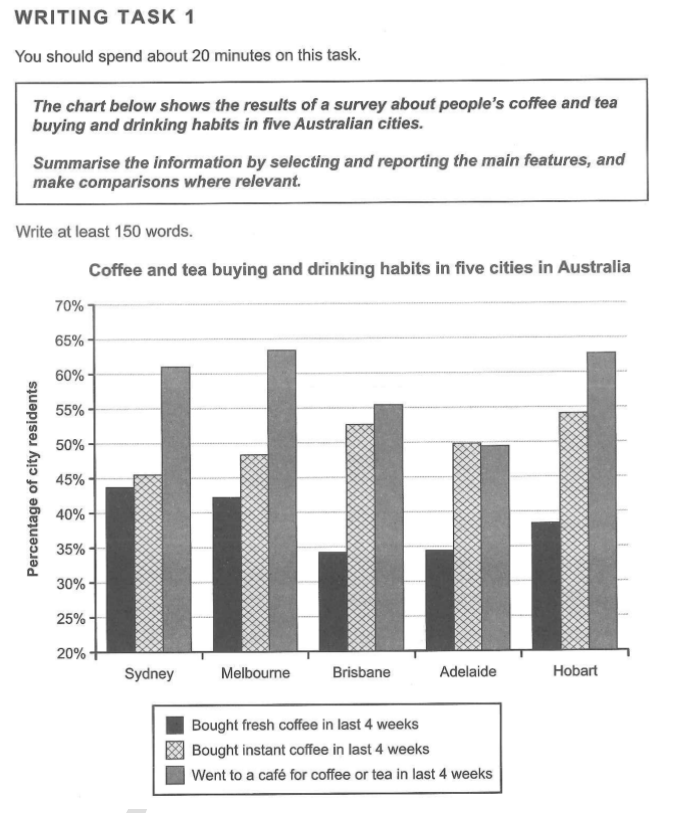
Additionally,intermsofthosewhoboughtinstantcoffeeinlast4weeks,figuresofallfivecitiesarehigherthan45%,withHobartaccountingforthehighestproportionat54%,followedbyBrisbane(53%),Adelaide(50%),Melbourne(48%...
阅读: 74
热门文章
-
1.6月11日雅思笔试写作真题全解析,附高分范文
- 1
- 6月11日雅思笔试写作真题全解析,附高分范文
- 2022-06-13
- 1
-
2.雅思写作「环境类」词汇素材分享
- 2
- 雅思写作「环境类」词汇素材分享
- 2021-12-27
- 2
-
3.2021年12月雅思写作权威预测(谢鹏版)
- 3
- 2021年12月雅思写作权威预测(谢鹏版)
- 2021-12-27
- 3
-
4.2022年1月雅思写作预测|小作文流程图题目及范文解析!
- 4
- 2022年1月雅思写作预测|小作文流程图题目及范文解析!
- 2021-12-27
- 4
-
5.2022年1月雅思写作预测|小作文静态柱状图题目及范文解析!
- 5
- 2022年1月雅思写作预测|小作文静态柱状图题目及范文解析!
- 2021-12-27
- 5
-
6.2022年1月雅思写作预测|小作文动态图题及范文解析!
- 6
- 2022年1月雅思写作预测|小作文动态图题及范文解析!
- 2021-12-27
- 6
-
7.雅思写作:不同年龄层的人怎么准确地表达
- 7
- 雅思写作:不同年龄层的人怎么准确地表达
- 2021-12-27
- 7
-
8.12月25日雅思考试写作部分机经及解析
- 8
- 12月25日雅思考试写作部分机经及解析
- 2021-12-27
- 8
-
9.雅思写作精华语料| 老龄化及其解决办法!
- 9

- 雅思写作精华语料| 老龄化及其解决办法!
- 2021-12-22
- 9
-
10.雅思写作必备:百年党史关键词
- 10

- 雅思写作必备:百年党史关键词
- 2021-12-22
- 10
热门图文
-
剑16写作解析及高分范文 | TEST3 提高含糖食品价格
2021-07-29
-

雅思大作文环境类:环境影响商业 写作思路及范文赏析
2020-01-13
-

雅思大作文7分范文及解析:过分崇拜明星 写作思路分析
2020-01-07
-

雅思利弊类大作文社会类话题 一些语言正在消失 写作思路分析
2019-12-27
-

剑16写作解析 | TEST1了解建筑历史的原因与方式
2021-07-19
-

雅思大作文 平均工作时间更长的国家更成功 写作思路及范文
2020-02-04