雅思写作折线图范文:国家GDP分析
2019-10-25 16:54:58来源:网络作者: 素素阅读量:
Line Chart
【题目】

【范文】
The line graph shows the changes in the proportion of spending on three social causes as a share of GDP in a certain country since 2000, and predicts their trends up until 2025.
The expenditure on education in 2000 stood at five percent, slightly higher than the figures for healthcare and railroads. It had grown to reach a peak of almost 7% in 2005 before decreasing constantly to around 5% in present year. It is estimated that this reduction will continue, ending at 4%. In contrast, healthcare spending showed an upward trend, with only 4% in the first year, rising gradually by 2% in 2015, which overtook the figure for education counterpart. The proportion of money spent on this public sector is projected to experience 1an even more significant growth during the future seven-year period, and approximately 8% of the public fund is likely to go to this area by 2025, twice as much as the figures for the other two sectors.
In addition, apart from a marginal decline over the first half of the ten years in the survey, the percentage of spending on railroads, despite some fluctuations, has mained steady at roughly 3.8%. Such figure is predicted to be more stabilized at this level from 2017 to 2025.
Overall, it is expected that the disparity of the expenditure on these three sectors will be widened, with more funding being directed towards public medical services. (237 words)
【高分表达】
1.reach a peak of … 达到顶点值
2.show an upward trend… 呈现出上升的趋势
3.overtake the figure for … 超过了…的数字
相关文章

6月11日雅思笔试写作真题全解析,附高分范文
社会话题 大作文题目 Today people live longer after retiring from work. What problems does this cause for individuals and society? What can be done to address these problems? 题目解读 人均寿...
阅读: 68


2021年12月雅思写作权威预测(谢鹏版)
2021年12月雅思写作权威预测,大作文90%的可能性是议论文,利弊分析题型的可能性最大。社会类(包括社会生活和体育等)及教育类的话题可能性最高。特...
阅读: 54
2022年1月雅思写作预测|小作文流程图题目及范文解析!
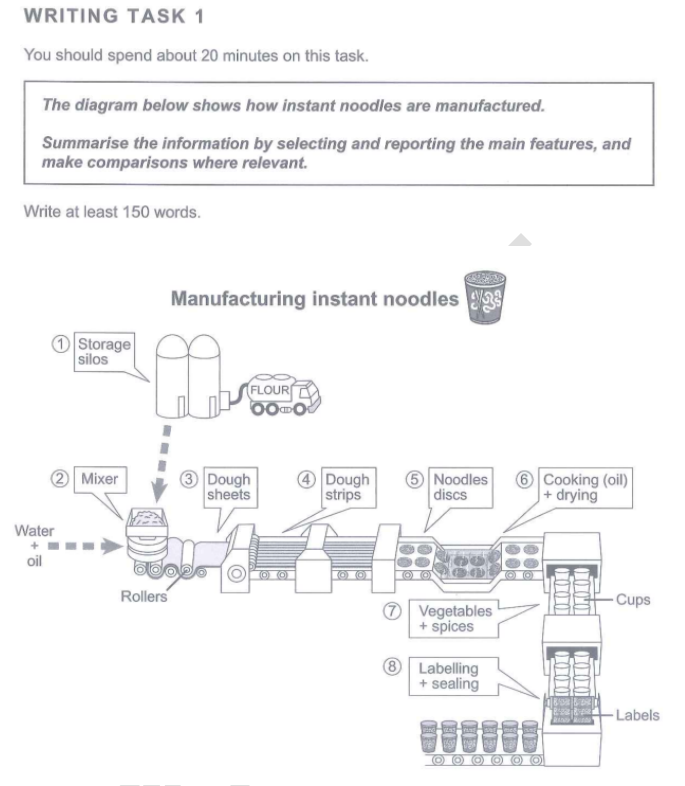
Inthenextstep,eachdrieddiscwillbeputintoacupandthencoveredbysomevegetablesandspicesFinally,thewholeprocessiscompletedbythoseinstantcupnoodlesbeingpackaged...
阅读: 78
2022年1月雅思写作预测|小作文静态柱状图题目及范文解析!
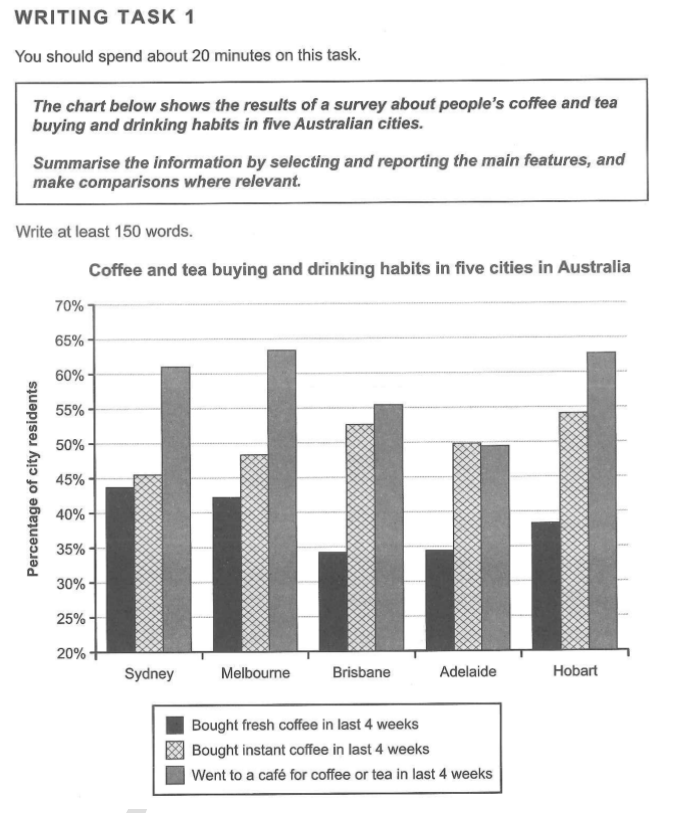
Additionally,intermsofthosewhoboughtinstantcoffeeinlast4weeks,figuresofallfivecitiesarehigherthan45%,withHobartaccountingforthehighestproportionat54%,followedbyBrisbane(53%),Adelaide(50%),Melbourne(48%...
阅读: 71
热门文章
-
1.6月11日雅思笔试写作真题全解析,附高分范文
- 1
- 6月11日雅思笔试写作真题全解析,附高分范文
- 2022-06-13
- 1
-
2.雅思写作「环境类」词汇素材分享
- 2
- 雅思写作「环境类」词汇素材分享
- 2021-12-27
- 2
-
3.2021年12月雅思写作权威预测(谢鹏版)
- 3
- 2021年12月雅思写作权威预测(谢鹏版)
- 2021-12-27
- 3
-
4.2022年1月雅思写作预测|小作文流程图题目及范文解析!
- 4
- 2022年1月雅思写作预测|小作文流程图题目及范文解析!
- 2021-12-27
- 4
-
5.2022年1月雅思写作预测|小作文静态柱状图题目及范文解析!
- 5
- 2022年1月雅思写作预测|小作文静态柱状图题目及范文解析!
- 2021-12-27
- 5
-
6.2022年1月雅思写作预测|小作文动态图题及范文解析!
- 6
- 2022年1月雅思写作预测|小作文动态图题及范文解析!
- 2021-12-27
- 6
-
7.雅思写作:不同年龄层的人怎么准确地表达
- 7
- 雅思写作:不同年龄层的人怎么准确地表达
- 2021-12-27
- 7
-
8.12月25日雅思考试写作部分机经及解析
- 8
- 12月25日雅思考试写作部分机经及解析
- 2021-12-27
- 8
-
9.雅思写作精华语料| 老龄化及其解决办法!
- 9

- 雅思写作精华语料| 老龄化及其解决办法!
- 2021-12-22
- 9
-
10.雅思写作必备:百年党史关键词
- 10
- 雅思写作必备:百年党史关键词
- 2021-12-22
- 10
热门图文
-
剑16写作解析及高分范文 | TEST3 提高含糖食品价格
2021-07-29
-

雅思大作文环境类:环境影响商业 写作思路及范文赏析
2020-01-13
-

雅思大作文7分范文及解析:过分崇拜明星 写作思路分析
2020-01-07
-

雅思利弊类大作文社会类话题 一些语言正在消失 写作思路分析
2019-12-27
-
剑16写作解析 | TEST1了解建筑历史的原因与方式
2021-07-19
-

雅思大作文 平均工作时间更长的国家更成功 写作思路及范文
2020-02-04