雅思剑15合成图题目分析来啦!剑15详解
2020-06-24 09:42:25来源:网络作者: 素素阅读量:
剑15合成图题目分析来啦!合成图在数据类型图表中的确是小众的题目,在每年的考试中也就那么三五次能和各位考生见面。但是,在近年的剑14和15中,都有合成图的出现。
其实,剑15中的合成图是非常的中规中矩的,反观剑14中的合成图却稍带难度。
今天陆哲老师带大家一起简单分析几个合成图例文,供大家参考。

之所以说这个合成图中规中矩就是因为它是比较典型的由两个独立的图表构成,而且两个图的数据量差别显而易见。所以,将两个图分别描写再分别总结即可。
Destinations of Anthropology graduates from a certain university after their graduation are listed in the pie chart. More than half (52%) of them obtained full-time employment, far higher than graduates who couldonly be employed part time (15%). Unluckily, 12% of them had to face unemployment, 4% higher than those choosing to further their study full time or those whose destinations were unknown. Only 5%, the lowest proportion of this pie, chose both part-time work and postgraduate study at the same time.第一段,直接改写图一的图表描述,再将对图一的描写直接写完。由于图一就是简单典型的静态图,这部分的描写毫无难度可言。
Four income levels of Anthropology graduates with five-year’s working experience in three types of employment are listed in the table. In terms of those working as freelance consultants and for thegovernment sector, 80% of them are able to earn more than 75,000 dollars, and 40% and 50% of them can have an income over 100,000 dollars respectively. 20% have to face relatively low income less than 74,999 dollars, and the earning of only 5% is between 25,000 and49,999 dollars. In contrast, the pattern of those employed in private companies is different, with 35% earning 50,000 to 74,999 dollars,30% over 100,000 dollars, 25% 75,000 to 99,999 dollars, and 10%encountering the lowest income level (25,000-49,999 dollars).
本题的图二数据量较大,大家的写的时候注意语言的总结性,不要写的篇幅过长。
Inconclusion, most Anthropology graduates could be successfully employed full time or part time, and after 5 years government employees have superior salary levels to private company staff andfreelancers.
由于两幅图之间无根本性联系,所以分别在结尾段进行总结即可。
接下来我们再来回忆一下剑14中的流程图。
其实论难度,这道题略高。大家要注意如下几点:
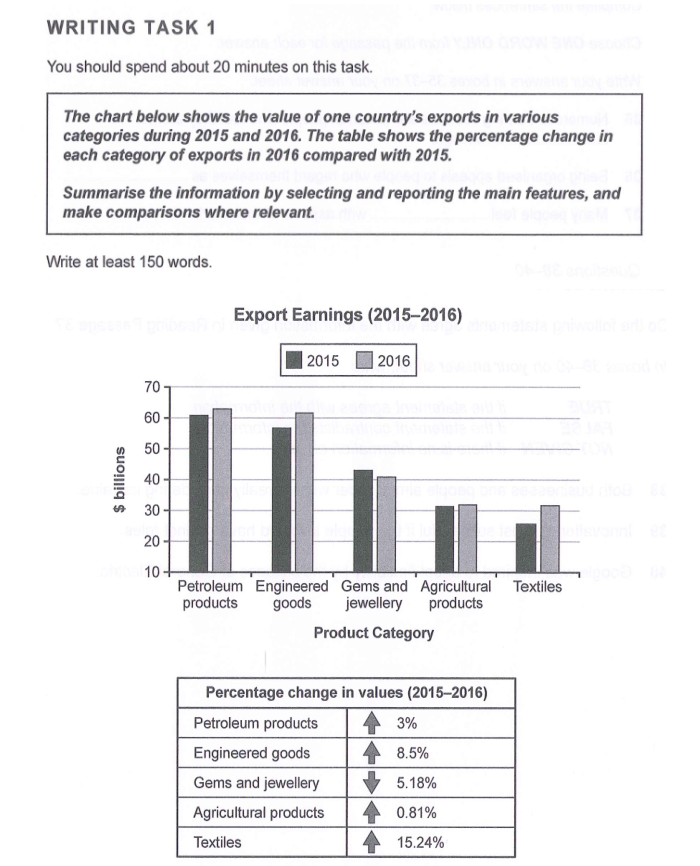
第一,本题由一个动态的柱状图和一个静态的表格组成。柱图显而易见是一个动态图,体现了两年间五项数据的变化。而表格虽展示的是数据的变化率,但就其本身而言只是几个数据的罗列,并无任何变化趋势等特征。因此表格为静态图。
第二,两图之间的关系比较微妙,此处需要详细解释。在一部分混合型题目中,两个图表可能并没有密切的数据关系。不寻常的是,本题的表格其实是对柱状图数据的一个细致解读,而并非独立存在。这也是本题写作中的一个重点亦是难点。
第三,由于本题数据来自于2015和2016两年,因此在书写时应该注意一般过去时和过去完成时的应用。如下例文供大家参考。
It is illustrated by the first bar chart how much income five differentsorts of exported products made in 2015 and 2016 in a certain country, and the second table demonstrates the variation trend ofeach product based on the date of both these two years.
In 2015, petroleum products contributed more than 60 billion dollars(b), closely followed by engineered goods (around 57b). Values ofother three items were all lower than 50b, and textiles played theleast significant role, only bringing about 25b.
One year later, the item of gems and jewellery was the only one that experienced a decline, decreasing by 5.18% to approximately 41b. By contrast, all other four items underwent an increasing trend. Valuesof textiles and engineered goods both witnessed a noticeable rise of 15.24% and 8.5% respectively. Similarly, slight growths happened topetroleum products and agricultural products. To be specific, the former reached around 64b, 3% higher than in 2015, and the latter after a 0.81% increase arrived at roughly 32b.
To sum up, the value of petroleum products was always the highest in these two years, and because of a sharp increase percentage of textiles the lowest in 2015 became as high as that of agriculture products in 2016.
再附赠两个较为常见的流程图例文。
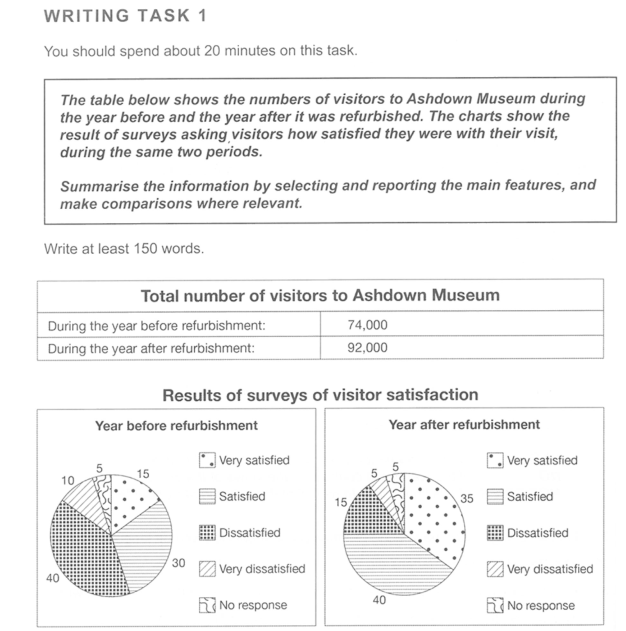
It is illustrated by the table that how numbers of people who visited Ashdown Museum before and after its refurbishment had changed.Obviously, the number rose to 92,000 after the year when this museum was refurbished, from 74,000 before the year.
Results of visitors' satisfaction surveys before and after the year are indicated by these pie charts. In the year before refurbishment, the percentage of visitors who felt dissatisfied amounted to the highest share at 40%, closely followed by that of who felt satisfied (30%).Only 15% of visitors were quite satisfied with their visits.Unluckily, 10% of visitors expressed an extremely disappointed attitude toward their trip. Meanwhile, people who answered nothing to this survey constituted 5%.
After the refurbishment, figures of who felt satisfied and very satisfied underwent remarkable increases by 10% and 20%, to 40% and 35%respectively. On the contrary, the proportion of visitors with disappointment decreased noticeably, with the figure for those whofe lt dissatisfied declining to 15% and those who were very dissatisfied 5% only. Similarly, 5% of visitors still gave nocomments on their visit.
To sum up, due to the refurbishment, this museum attracted more visitorsthan before. Meanwhile, more visitors showed their satisfying attitude to their trips there.
C4T4
The charts below give information about travel to and from the UK, and about the most popular countries from UK residents to visit.
Summarisethe information by selecting and reporting the main features, andmake comparisons where relevant.
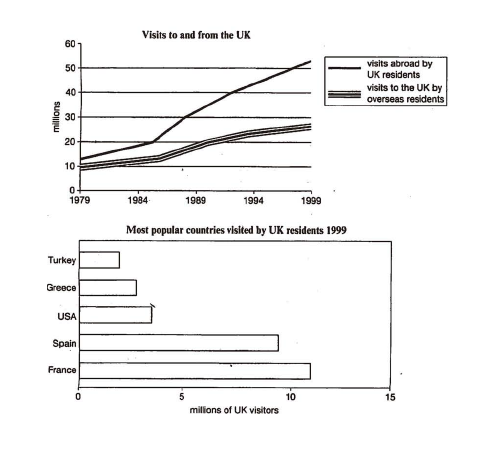
It is indicated by this line chart how the number of travelers from and to UK had changed from 1979 to 1999. Starting from around 14 million,the number of tourists from UK increased constantly to 20 million in1985, and then grew up rather rapidly until 1999, reaching the peakat 54 million. Meanwhile, the number of tourists to UK under wentnearly the same trend, ascending moderately initially from 10 millionin 1979 to 14 million in 1986 and then soaring until 1999 (at 26million).
Top five the most prevalent tourism destinations for Britain travelers in1999 are listed by this bar chart. In that year, 11 million travelers from UK visited their neighboring country France, which was the most popular one for Britain tourists followed by Spain attracting 9 million Britain tourists. Other three popular countries were USA,Greece, and Turkey, receiving 4, 3, and 2 million British travelers respectively.
In summary, during the whole period, the number of tourists from UK was always higher than that of tourists to UK, and the disparity was becoming larger and larger. In 1999, the number of the former wast wice as high as that of the latter, and in the same year France was the destination that the most British travelers visited.
相关文章


-
-

如何在一个月左右迅速提高雅思口语和听力水平?成功案例分享!
今天小编给大家讲一个关于逆袭雅思备考故事。主角是一位一个理解能差,自学能力差的学员,但也从5.5到7的过程。 四级六级完全不具有参考性,我虽然...
阅读: 55
更多栏目
热门文章
-
1.哪儿托福培训好?环球教育是你的不二之选
- 1
- 哪儿托福培训好?环球教育是你的不二之选
- 2022-03-13
- 1
-
2.哪培训托福好?去美国留学托福要考多少分?
- 2
- 哪培训托福好?去美国留学托福要考多少分?
- 2022-03-10
- 2
-
3.托福辅导应该怎么选择培训机构?
- 3
- 托福辅导应该怎么选择培训机构?
- 2022-03-09
- 3
-
4.雅思哪家机构好以及有什么优选课程
- 4
- 雅思哪家机构好以及有什么优选课程
- 2022-03-09
- 4
-
5.如何在一个月左右迅速提高雅思口语和听力水平?成功案例分享
- 5
- 如何在一个月左右迅速提高雅思口语和听力水平?成功案例分享
- 2022-03-09
- 5
-
6.雅思培训机构哪个比较好?如何判断雅思机构的好坏?
- 6

- 雅思培训机构哪个比较好?如何判断雅思机构的好坏?
- 2022-03-09
- 6
-
7.雅思辅导机构要如何选择?这6点一定要问清楚!
- 7

- 雅思辅导机构要如何选择?这6点一定要问清楚!
- 2022-03-09
- 7
-
8.不同国家出国留学雅思要求分别是多少分?
- 8
- 不同国家出国留学雅思要求分别是多少分?
- 2022-03-03
- 8
-
9.托福培训哪里好?帮助学员改善学习方式!
- 9

- 托福培训哪里好?帮助学员改善学习方式!
- 2022-03-03
- 9
-
10.哪托福班好?选择托福班有哪些技巧?
- 10
- 哪托福班好?选择托福班有哪些技巧?
- 2022-03-01
- 10
热门图文
-

环球雅思的价格是多少?环球雅思课程价目表详解!
2020-08-19
-
环球雅思学费多少钱?大概是什么价位?
2020-07-14
-

环球雅思英语培训课程价目表介绍
2020-07-24
-

环球雅思学费贵吗?环球雅思课程价格表介绍!
2020-03-13
-

环球雅思一对一费用是多少?基本费用介绍!
2020-01-07
-

IELTS Indicator 与雅思考试有哪些区别?
2020-04-25